iuav / fPT — Venezia
Design dell'Informazione (magistrale SIT&TLR)
(2012)
links:
blogs /
graphic designers /
video /
books /
references /
tools
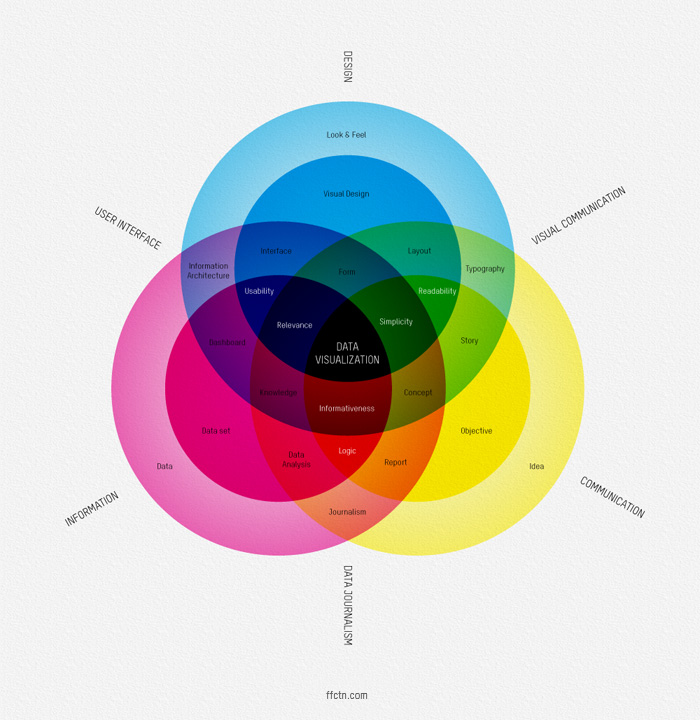
introduzione: Information Design
lezione 01: The Joy of Statistic / video (BBC)
lezione 02: The 7 ½ Steps to Successful Infographics
—
lezione 03: Visualisazione dei dati: Tipi d'interazione
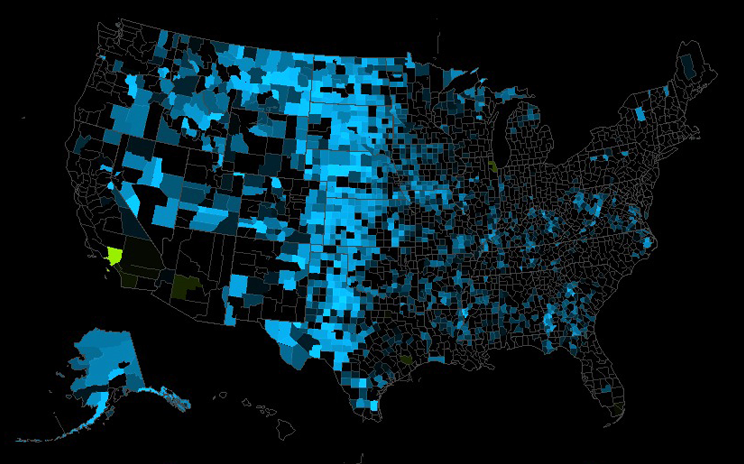
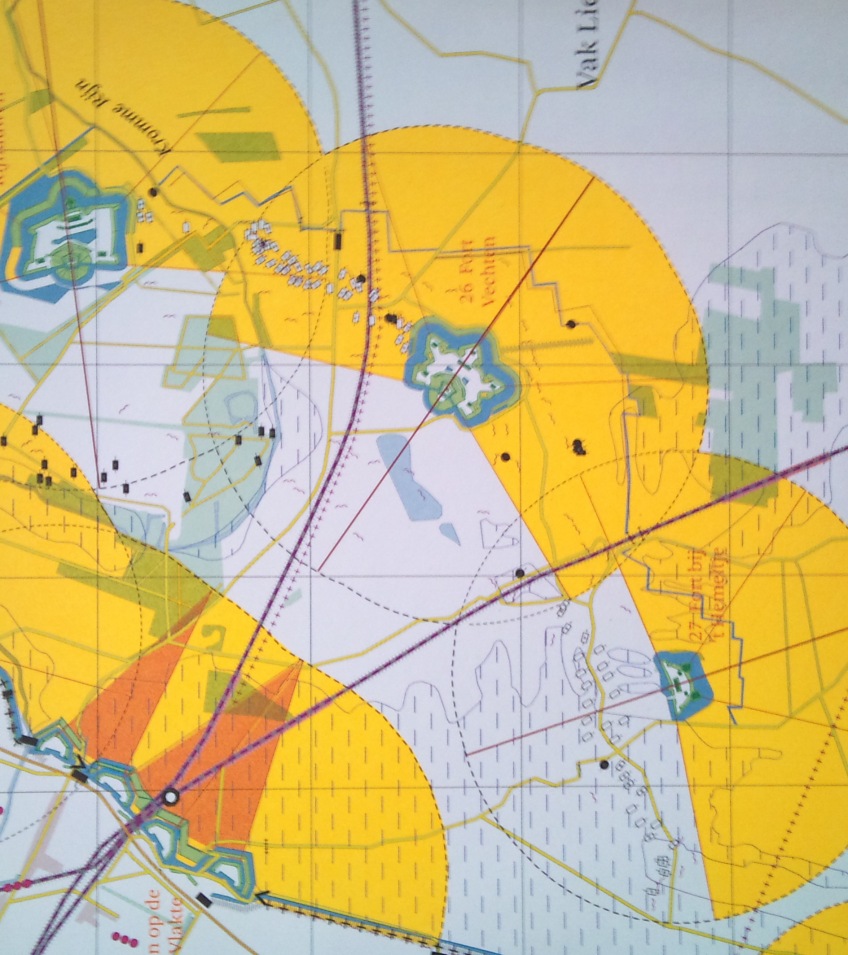
lezione 04: Mapping the territory (Joost Grootens / Lust / Catalogtree) + Migropolis. Venice / Atlas of a Global Situation
/ assegnazione del esercizio
lezione 05: Milestones in History of Data Vizualisation
lezione 06: Data Flow /contemporary infodesign
—
lezione 07: Anatomy Lesson on Information Design Patterns
lezione 08 : Narrative Visualization: Telling Stories with Data (E. Sege, J. Heer / Stanford University)
[ approfondimento : Journalism in the Age of Data (video, 54' / Stanford University) ]
lezione 09 : Processo segnico (Dr. Lionello)
lezione 10 : Psicologia della Gestalt (Dr. Lionello)
[ approfondimento : Graphical perception (research studies/experiments : quantitative data representation) ]
—
lezione 11 : Jacques Bertin : Semiology of Graphics
lezione 12: Edward Tufte : Graphic Excellence
/ presentazione degli esercizi
/ conclusione